
Portfolio Monitoring
Portfolio Monitoring aggregates ESG controversy data across a list of companies, giving you a ranked view of risk exposure for your watchlists and portfolios. It is the main dashboard for managing and monitoring multiple companies at once.
Your portfolios
Your portfolios and watchlists are accessible from the portfolio icon in the left-hand navigation or from the dropdown at the top of the Portfolio Monitoring page.
SESAMm sets up your initial portfolios when your account is created, based on the company lists you provide during onboarding.
Creating a new portfolio
- Click the portfolio icon in the navigation and select New.
- Give the portfolio a name.
- Choose whether it should be Private (visible only to you) or Shared (visible to all users in your organization).
- Add companies by searching for them one at a time, or upload a CSV file with a list of company names plus any available identifiers (website, country, ISIN, LEI). SESAMm's team will match these to the correct entities and flag any that need confirmation.
Tip: For large lists, CSV upload is the fastest option. Your account manager can also upload portfolios on your behalf.
The Portfolio Monitoring view
The Portfolio Monitoring view consists of several tables and charts to help your monitor and evaluate your portfolio companies.
Portfolio CES
The Portfolio CES gives you a single daily measure of your portfolio’s overall exposure to controversies. It is calculated as the simple average of the CES of every company in the portfolio, including those with a CES of 0. You see two values:
- Current: the latest score,
- Max: the highest daily value over the selected period
The Portfolio CES chart shows how this score has moved over time.
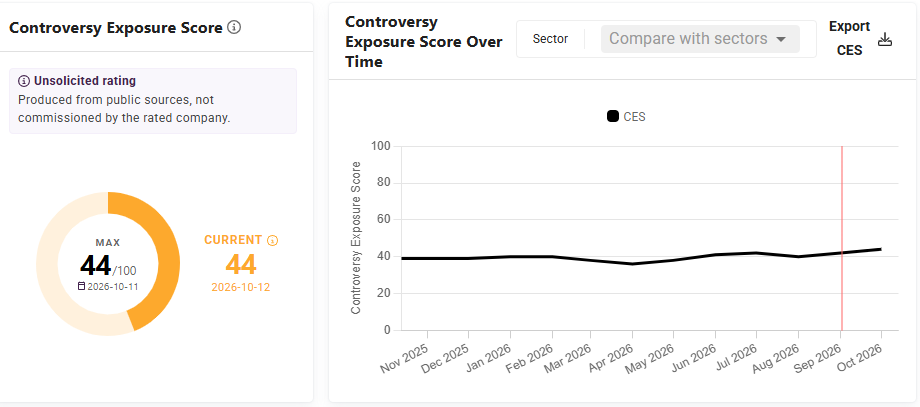
Controversy Exposure Score
The first table ranks companies by CES score. By default, the most recently and intensely controversial companies appear at the top.

UNGC Classification
Identify the companies with the highest UNGC classification and number of breaches over the period. Companies are ranked by the most severe classification and case count. By hovering over the case count, you can view the breakdown.

Cases by ESG pillar
The next section provides a breakdown of controversy Cases forthe Environmental, Social, and Governance pillars across the portfolio. Each table can be filtered by subrisk.

Related Cases
The Related Cases table gathers all cases from the portfolio. These can be sorted by intensity, UNGC classification, starting date, or last activity date. They can also be filtered by UNGC classification or event intensity, making it easy to identity the most severe controversies across the portfolio.

Cases by Subrisk
The Cases by Subrisk table provides a unified view of case exposure by subrisk. This ladder view shows case volume and maximum intensity in a single row. Click any subrisk to drill down into related cases.

Filtering the portfolio
The filter at the top of the dashboard can be used to narrow the view to specific topics or themes. The tables and charts will update to show only relevant companies and Cases.
