
Sector Controversy Exposure Score
Overview
The Sector CES is a daily benchmark that shows the typical level of controversy exposure in a sector, so you can read any company's CES against its peers.
It is calculated as the average Controversy Exposure Score (CES) of the 100 largest companies in each of 21 sectors, classified under the international ISIC Rev. 4 standard. It uses exactly the same underlying data and scoring as the company-level CES.
As a reminder, the CES is a continuous score from 0 to 100 that quantifies a company's exposure to controversies over time, taking into account the severity of incidents and the number of articles.
Why sector context matters
The same CES can mean very different things depending on the sector a company operates in. The Sector CES provides a reference point, to help you can answer questions such as:
- Is this company more or less exposed to controversies than is typical for its sector?
- Is a rise in a company's CES specific to the company, or part of a wider movement across its sector?
- How does the overall controversy exposure of a sector evolve over time?
How each sector's reference group is built
Each sector is represented by its 100 largest companies, measured by number of employees.
How the Sector CES is calculated
The Sector CES for a given day is the simple average of the CES of the companies in that sector's reference group on that day. Like the company-level CES, the result ranges from 0 to 100.
- Frequency: one value per sector, calculated daily.
- Inputs: the published company-level CES only. No additional weighting, adjustment or analyst judgement is applied.
- Consistency: because it is built from the same scores, a company's CES and its Sector CES are directly comparable on the same 0–100 scale.
Where to find the Sector CES
In the platform, the Sector CES appears on the entity page, overlaid on the existing "Exposure to Controversies Over Time" chart.
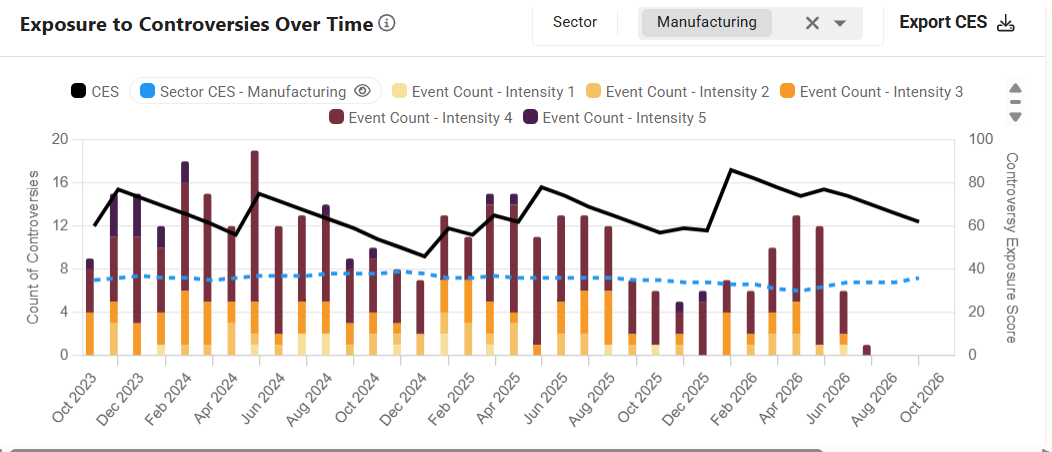
- Dashed line: the Sector CES is shown as a dashed line alongside the company's CES.
- Sector label: the sector used for the comparison is always named.
- Show or hide: click the Sector CES label in the chart legend to toggle it on or off.
- Multi-sector companies: a selector lets you switch between the sectors the company is mapped to.
- Missing Sector CES: if a company has no sector mapping, the chart shows the company's CES only.
How sectors are defined
Sectors follow the United Nations' International Standard Industrial Classification of All Economic Activities, Revision 4 (ISIC Rev. 4).
| Code | Sector |
|---|---|
| A | Agriculture, forestry and fishing |
| B | Mining and quarrying |
| C | Manufacturing |
| D | Electricity, gas, steam and air conditioning supply |
| E | Water supply; sewerage, waste management and remediation activities |
| F | Construction |
| G | Wholesale and retail trade; repair of motor vehicles and motorcycles |
| H | Transportation and storage |
| I | Accommodation and food service activities |
| J | Information and communication |
| K | Financial and insurance activities |
| L | Real estate activities |
| M | Professional, scientific and technical activities |
| N | Administrative and support service activities |
| O | Public administration and defence; compulsory social security |
| P | Education |
| Q | Human health and social work activities |
| R | Arts, entertainment and recreation |
| S | Other service activities |
| T | Activities of households as employers; undifferentiated goods and services producing activities of households for own use |
| U | Activities of extraterritorial organizations and bodies |
A company whose activities span several sectors can be mapped to more than one of them.
Frequently asked questions
- Is the Sector CES a new score? No. It is an aggregation of the existing company-level CES, using the same data and methodology. It adds sector context to the CES rather than a separate assessment.
- Why ISIC Rev. 4 rather than GICS or ICB? SESAMm covers millions of companies, most of which are private. Classifications such as GICS or ICB, cover at best a few hundred thousand companies (active and inactive combined), and are not available for every listed company either. ISIC Rev. 4 is an open, internationally recognised standard that can be applied consistently across public and private companies alike.
- Why the largest companies? This follows the approach commonly used for financial indices. The aim is a group that is representative of its sector, and the larger a company, the more likely it is to reflect the sector's activity and the scrutiny it attracts.
- Why number of employees as the size measure? Market capitalisation is not available for private companies, and revenue is reported in many different currencies, which makes like-for-like comparison unreliable. Headcount is available for the large majority of companies we cover and is comparable across countries.
- Can a company belong to more than one sector? Yes. A company whose activities span several sectors can be mapped to each of them, and you can switch between sector benchmarks in the platform.
- Why does a company have no Sector CES line? The company has no sector mapping yet. Its CES is still displayed as usual.
CES Methodology
The Sector CES is derived from the Controversy Exposure Score. Find more information about the CES on the CES methodology page.